A huge assortment of market information is available for traders to find, understand, analyse and predict future market movements. All this info can get confusing. Charts are an organised way of representing this information, making it easier to understand past price movements and potential future price direction. They can be used for all types of online trading and all instruments, including stocks, forex, commodities, options, CFDs and cryptocurrencies.
Historical price, volume and volatility data are applied on charts across different timeframes, such as 1 minute, 5 minutes, 15 minutes, 60 minutes, 1 day or 1 week, to derive signals for informed trading decisions.
Did you know?
The first known line, pie, and bar charts were invented by the Scottish political economist William Playfair at the end of the 18th century. Of these, line and bar charts are still used in trading today.
The 3 Types of Trading Charts
Every asset has an opening and a closing price for every trading session. In addition, there are high and low prices for each session. These price points are plotted on the charts and joined in different ways to make the different types of charts. There are 3 types of charts used in online trading.
1. Line Chart
Line charts are constructed by joining only the closing prices of an asset over a specific timeframe. These charts are believed to cut out noise that may corrupt the data and hence the analysis. An important observation here is that line charts completely ignore the opening positions or the direction in which the price moved before reaching the closing point.
For a trading chart, any kind of information not helpful in plotting the chart or deducing signals from it, is called noise.
2. Bar Chart
Bar charts help in identifying the high and low points of an asset’s price, along with where the open and close prices. This gives insight into how the price moved for the chosen timeframe. The closing prices reflect whether buyers or sellers had more influence on the asset at the end of the specific duration.
How is a Bar Chart Constructed?
The highest and lowest prices are connected with a line. The opening price is marked with a bar on the left and closing price is marked with a bar on the right side of the vertical line.
3. Candlestick Chart
Munehisa Homma, a Japanese rice trader, invented a method of recording rice price action, which is today known as the candlestick chart. He used these candlesticks to predict future rice prices and became the most successful futures trader in the 18th century, at the Dojima Rice Exchange of Osaka, the world’s first futures exchange.
Today, candlestick charts are the most widely used charts for online trading across the financial markets, including stocks, forex, commodities, cryptocurrencies and more. Technical indicators or signals are generated by studying the patterns made by candlesticks.
A Candle
A candle represents a period of time with its top and bottom wicks (or shadows) representing the high and low price of the asset. The body of the candle represents the opening and closing price points.
Candle Colour
A red (bearish) candlestick means the price closed lower that its opening price and a green (bullish) candle represents a higher closing price than the opening.
Common Candlestick Patterns
Placing one candlestick after the other on the chart generates patterns. These patterns help in identifying price direction, buying or selling pressure in the market, bull or bear runs, etc. Based on this, traders can identify entry and exit points.
Trendlines
A line indicating the direction of price movement is called a trendline. It’s like an outer line around the candlestick to express the market behaviour over a certain time period. They help in forming patterns and also indicate the resistance and support areas for the price.
Did you know?
Candlestick patterns can be used to identify bearish and bullish trends, as well as trend continuation. Some of the most popular chart patterns are the Doji, Hammer, Head and Shoulders, Morning/Evening Star and Hanging Man.
Chart Patterns and What They Mean
There are three main types of chart patterns:
1. Reversal Chart Pattern
Reversal patterns indicate that the market is going to change direction. This means a bearish market is leaning towards turning bullish and vice versa. The six most common indicators of a reversal are double top/bottom, head and shoulders, inverse head and shoulders, and rising and falling wedge patterns.
2. Continuation Chart Pattern
These chart patterns indicate that the current market trend is likely to continue. Also known as consolidation patterns, they may not move in a straight line though. They could move sideways, then correct and then regain the trend momentum. The most common continuation patterns are rectangle, wedge and pennant.
3. Bilateral Chart Pattern
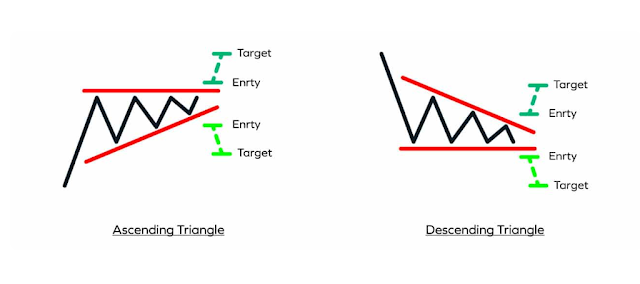
These indicate that the price could move in either direction. Therefore, experienced traders use other indicators in combination with bilateral patterns to assess the appropriate entry and exit points. Bilateral charts tend to form triangular patterns, such as ascending, descending and symmetrical triangles.
Informed trading is based on the science of understanding signals and predicting future market moves. There is no one magic signal that will always give successful results. Based on the asset being traded, market sentiment, news around the asset or the economy, indicators should be carefully chosen. Historical analysis and indicator accuracy studies help traders decide which indicators would be most suitable for the type of trade they want to participate in.
Key Takeaways
1. For a given timeframe, a chart aggregates every buy and sell transaction of a specific financial instrument.
2. Charting helps traders gain a broad view of the price action movement over a specific period of time.
3. Line, Bar, and Candlestick are the three major charts used in trading.
4. Candlestick charts are the most comprehensive and widely used trading charts.
5. Chart patterns are used to deduce signals to make trading decisions.
Open a live account with ADSS to gain access to powerful charts and other tools of technical analysis.


